Investment Overview
First entrusted with USD 1 billion in 2006, KIC has consistently expanded its operating scale through stable and capable management.
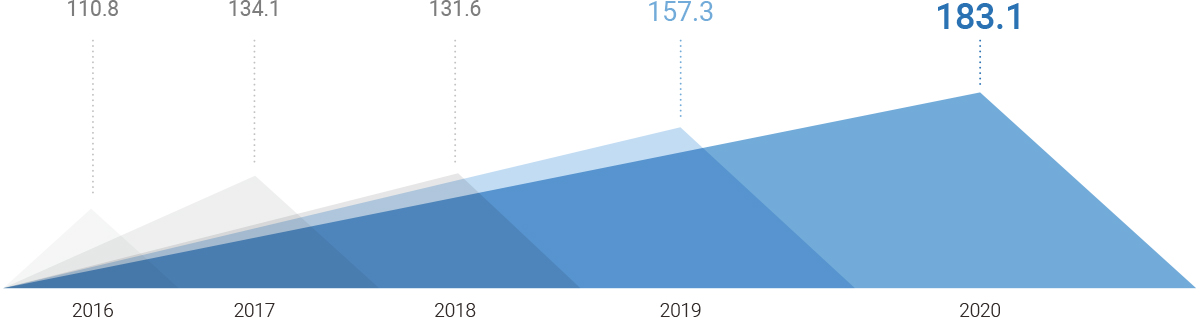
Our assets under management at the end of 2020 totaled USD 183.1 billion on the back of excellent investment performance, marking a 16% increase from 2019.
Following a principle of diversification, KIC manages a portfolio that is 84.7% traditional assets and 15.3% alternative assets, including private equity, real estate, infrastructure and hedge funds.
Our alternative assets, which have a low correlation with traditional assets and tend to pursue relatively higher returns, grew to USD 27.9 billion in 2020, or 14% (USD 3.4 billion) year-on-year. The proportion of our alternative assets, however, decreased slightly to 15.3% at the end of 2020 from 15.6% the previous year due to high returns on traditional assets (14.6%) last year.
Asset allocation (2020)
(USD billion, %)
| NAV | Weight** | ||
|---|---|---|---|
| Traditional assets | Equities | 78.2 | 42.7 |
| Fixed Income | 64.5 | 35.2 | |
| Other* | 12.5 | 6.8 | |
| Subtotal | 155.2 | 84.7 | |
| Alternative assets | Private equity | 11.8 | 6.5 |
| Real estate & infrastructure | 10.2 | 5.6 | |
| Hedge funds | 5.1 | 2.8 | |
| Cash equivalents | 0.8 | 0.4 | |
| Subtotal | 27.9 | 15.3 | |
| Total | 183.1 | 100.0 | |
* “Other” refers to inflation-linked bonds, cash, hybrid securities, etc.
** NAV basis
Asset allocation compared to the previous year
(%)

- ■ Equity
- ■ Fixed income
- ■ Alternative assets
- ■ Other
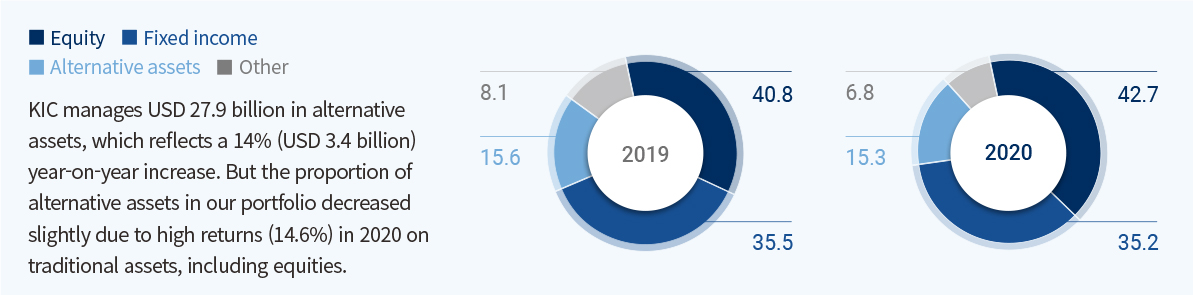
KIC manages USD 27.9 billion in alternative assets, which reflects a 14% (USD 3.4 billion) year-on-year increase. But the proportion of alternative assets in our portfolio decreased slightly due to high returns (14.6%) in 2020 on traditional assets, including equities.
- 2019
-
40.8
35.5
15.6
8.1 - 2020
-
42.7
35.2
15.3
6.8
In early 2020, countries worldwide began going into lockdown due to the spread of Covid-19, which triggered a global economic slowdown and sent the prices of high-risk assets plummeting. Despite a grim financial market outlook, a rapid economic recovery followed due to measures by the U.S. Federal Reserve and European Central Bank to slash policy interest rates and buy up assets to increase liquidity and give market participants a way to secure credit. Combined with large-scale fiscal policies by major governments and speedy progress in vaccine development, these measures drove asset prices past pre-pandemic levels to all-time highs.
Stock prices on the MSCI World Index rose 14.3% and indices in major regions excluding Europe also closed higher than they did at the beginning of the year. Bond prices on the Bloomberg Barclays Global Aggregate Bond Index rose 9.2% due to lower base rates and increased asset purchases.
Through proactively responding to changes in the financial environment and using our global investment and crisis management capabilities, KIC achieved a high return of 13.71%, or USD 21.8 billion in gains, in 2020. Our five-year annualized return was 8.96% and our annualized return since inception, 5.22%.
Assets under management by year
(USD billion)
| 2016 | 2017 | 2018 | 2019 | 2020 | |
|---|---|---|---|---|---|
| Annual investments* | 106.8 | 115.8 | 136.7 | 137.1 | 161.3 |
| NAV | 110.8 | 134.1 | 131.6 | 157.3 | 183.1 |
| Cumulative gains and losses | 15.8 | 34.1 | 29.0 | 49.2 | 71.0 |
* Sum of NAV at the end of the previous year and investments in 2020
Net asset value (NAV)
(USD billion)

- 2016
- 110.8
- 2017
- 134.1
- 2018
- 131.6
- 2019
- 157.3
- 2020
- 183.1
Return on total assets
KIC’s return on assets in 2020 stood at 13.71%, with a five-year annualized return of 8.96% and an annualized return since inception of 5.22%.
(%)
| 2016 | 2017 | 2018 | 2019 | 2020 | |
|---|---|---|---|---|---|
| Return on total assets (before fees) | 4.35 | 16.42 | -3.66 | 15.39 | 13.71 |
| Return on total assets (after fees) | 4.21 | 16.26 | -3.80 | 15.21 | 13.52 |
| Annualized return since inception | 3.34 | 4.45 | 3.76 | 4.60 | 5.22 |
Return on traditional assets
The return on traditional assets in 2020 was 14.62%, +144 bps compared to the benchmark.
(%)
| 2016 | 2017 | 2018 | 2019 | 2020 | Annualized return for the past five years (’16-’20) |
Annualized return since inception |
||
|---|---|---|---|---|---|---|---|---|
| Total | Return | 3.96 | 16.71 | -5.64 | 16.62 | 14.62 | 8.88 | 5.60 |
| Excess return | -95 | 129 | -81 | 33 | 144 | 19 | 26 | |
| Equities | Return | 5.85 | 25.50 | -9.55 | 27.52 | 19.16 | 12.79 | 5.58 |
| Excess return | -232 | 122 | -71 | 6 | 261 | 7 | 5 | |
| Fixed income | Return | 1.46 | 8.00 | -1.32 | 7.53 | 9.88 | 5.02 | 4.38 |
| Excess return | 29 | 72 | -13 | 73 | 78 | 46 | 32 | |
Return on alternative assets
Annualized return since inception: 7.70%
(%)
| Inception | Annualized return since inception | |
|---|---|---|
| Private equity | 2009. 09. 16 | 9.27 |
| Real estate & infrastructure | 2010. 03. 15 | 7.25 |
| Hedge funds | 2010. 01. 29 | 5.16 |
| Alternative asset total* | 7.70 |
* Total includes commodities (categorized as traditional assets since April 2011)
Benchmarks for each asset class
| Asset class | Type | Benchmark |
|---|---|---|
| Traditional assets | Equities | Morgan Stanley Capital International All Country World Index ex Korea (unhedged) |
| Fixed income | Bloomberg Barclays Global Aggregate Index ex KRW ex Korea (unhedged) | |
| Inflation-linked bonds | Bloomberg Barclays Global Inflation-linked Bond Index | |
| Cash | ICE BofA Merrill Lynch 3-Month US Treasury Bill | |
| Alternative assets | Private equity | Morgan Stanley Capital International All Country World Index ex Korea (unhedged) + 2%, 3 months lagged |
| Real estate & infrastructure | G7 inflation rate + 4%, 3 months lagged | |
| Hedge funds | BofA Merrill Lynch 3-Month US Treasury Bill + 3.5%, 1 month lagged |
TEL +82-2-2179-1000 FAX +82-2-2179-1065