2024 Annual Report
Investment Highlights
Investments
Governance & Organization
Key Figures
AUM
Return on Total Assets
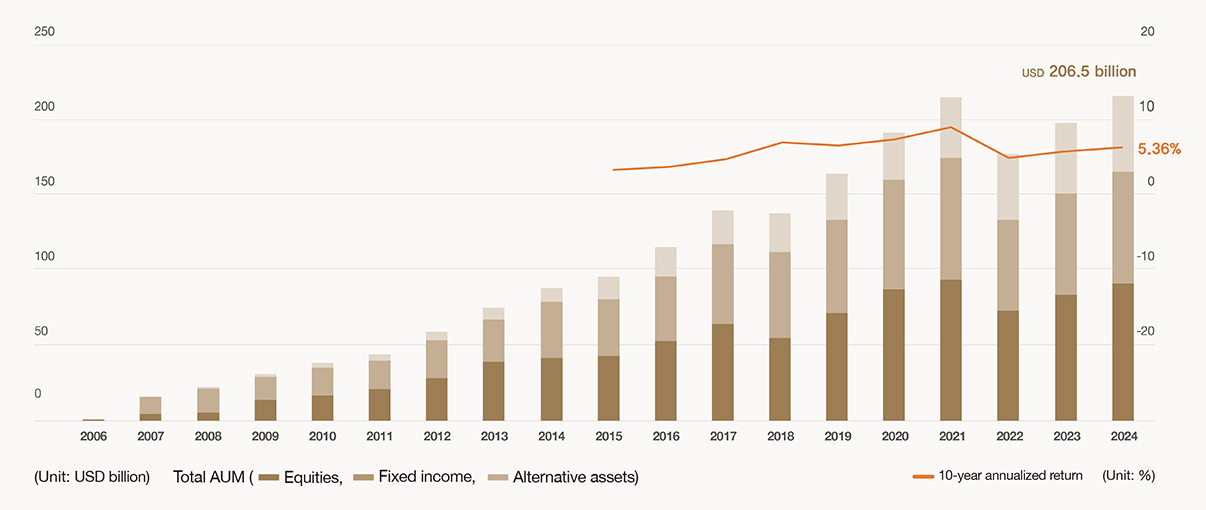
As of the end of December 2024, KIC managed approximately
USD 206.5 billion in assets, with cumulative investment returns
totaling about USD 93.9 billion.
Return on total assets
| Category | 2020 | 2021 | 2022 | 2023 | 2024 |
|---|---|---|---|---|---|
| Total AUMUSD billion | 2020 : 183.1 | 2021 : 205 | 2022 : 169.3 | 2023 : 189.4 | 2024 : 206.5 |
| Annual return before expenses% | 2020 : 13.71 | 2021 : 9.13 | 2022 : -14.36 | 2023 : 11.59 | 2024 : 8.49 |
| Annual return after expenses% | 2020 : 13.52 | 2021 : 8.94 | 2022 : -14.46 | 2023 : 11.44 | 2024 : 8.35 |
| 10-year annualized return% | 2020 : 6.13 | 2021 : 7.50 | 2022 : 4.68 | 2023 : 4.92 | 2024 : 5.36 |
| Annualized return since inception% | 2020 : 5.22 | 2021 : 5.47 | 2022 : 4.12 | 2023 : 4.54 | 2024 : 4.75 |
Return on traditional investments
The return on traditional assets in 2024 was 9.30%, +3 bps compared to the benchmark.
| Category | 2020 | 2021 | 2022 | 2023 | 2024 | Annualized return for the past 5 years |
Annualized return since inception |
|
|---|---|---|---|---|---|---|---|---|
| Total | Return% | 14.62 | 6.75 | -17.58 | 14.35 | 9.30 | 4.74 | 4.89 |
| Excess returnbp | 144 | -39 | -52 | -6 | 3 | 5 | 14 | |
| Equities | Return% | 19.16 | 18.61 | -19.27 | 22.44 | 18.83 | 10.67 | 6.26 |
| Excess returnbp | 261 | -92 | -137 | -13 | 10 | -6 | -11 | |
| Fixed income |
Return% | 9.88 | -4.62 | -16.65 | 6.34 | -0.19 | -1.50 | 2.44 |
| Excess returnbp | 78 | 39 | 14 | 14 | 2 | 29 | 29 | |
Return on alternative investments
Annualized return since inception: 7.68%
| Category | Inception | Annualized return since inception% |
|---|---|---|
| Private equity | 2009. 09. 16. | 9.41 |
| Real estate, infrastructure | 2010. 03. 15. | 6.83 |
| Hedge funds* | 2010. 01. 29. | 5.72 |
| Private debt** | 2024. 01. 02. | - |
| Total for alternative assets | 7.68 |
* Total includes commodities. (Categorized as traditional assets since April 2011.)
** Private debt has been managed as a separate asset class since January 2024.
AUM and returns
In 2024, KIC posted an annual return of 8.49%. The 10-year annualized return was 5.36%, and the annualized return since inception, 4.75%. Since its establishment, KIC has delivered consistent and stable returns exceeding the rate of inflation.
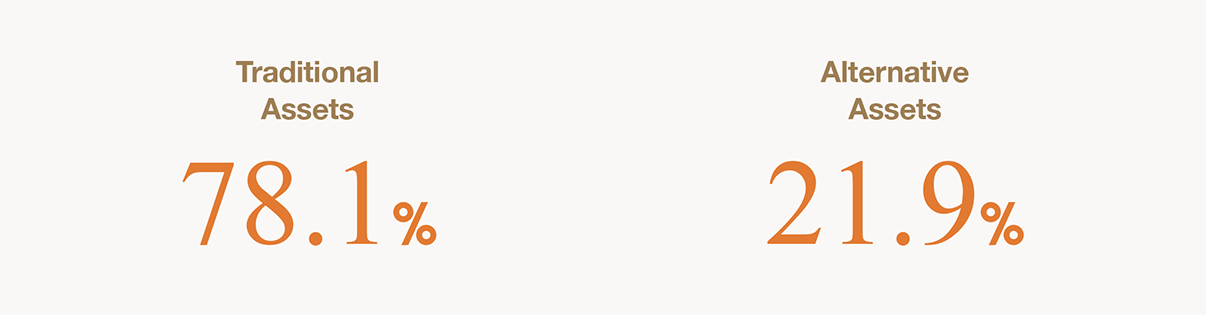
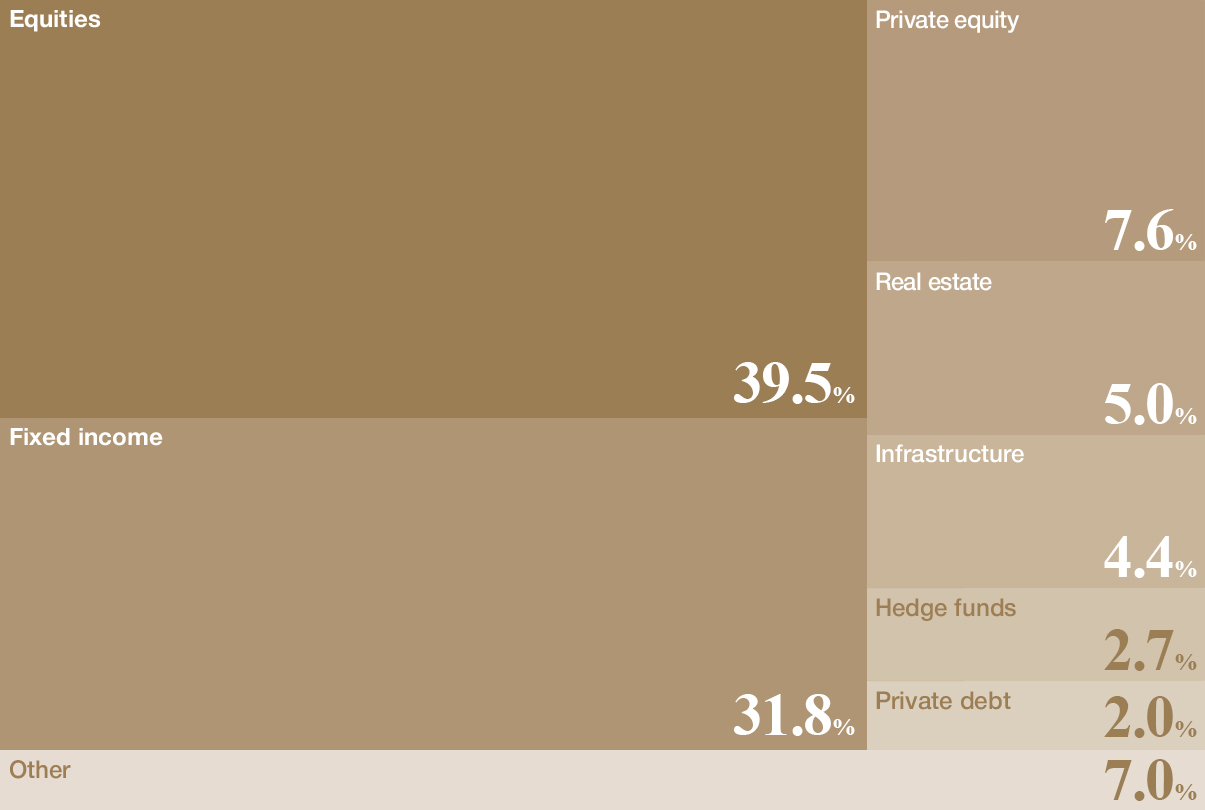
Asset allocation in 2024
Asset allocation by year
(Unit: %)
| 2023 | 2024 | |
|---|---|---|
| Equities | 39.2 | 39.5 |
| Fixed income | 31.5 | 31.8 |
| Alternative assets* | 22.0 | 21.9 |
| Other* | 7.3 | 6.8 |
| 100 | 100 |
* Other assets include inflation-linked bonds and cash.
Benchmarks for each asset class
| Asset class | Type | Benchmark |
|---|---|---|
| Traditional assets |
Equities | Morgan Stanley Capital International All Country World Index ex Koreaunhedged |
| Fixed income | Bloomberg Global Aggregate Index ex KRW ex Korea | |
| Inflation-linked bonds | Bloomberg Barclays Global Inflation-Linked Bond Index | |
| Cash | ICE BofA Merrill Lynch 3-Month US Treasury Bill | |
| Alternative assets |
Private equity | Morgan Stanley Capital International All Country World Index ex Koreaunhedged + 2%, 3 months lagged |
| Real estate, infrastructure | G7 inflation rate + 4%, 3 months lagged | |
| Hedge funds | BofA Merrill Lynch 3-Month US Treasury Bill + 3.5%, 1 month lagged | |
| Private debt* | Morningstar Global Leveraged Loan Index +1.25%, 3 months lagged |
* Private debt has been managed as a separate asset class since January 2024.
Investments by region
Based on the market value of traditional assets as of the end of December 2024
(Unit: %)
| Asia | 12.19 |
|---|---|
| North America | 63.97 |
| Europe | 21.72 |
| Other regions | 2.12 |
| 100 |
Investments by unit
KIC invests in funds around the world to generate more stable and sustainable returns.
(Unit: Count)
| Countries | 67 |
|---|---|
| Currencies | 39 |
| Equities | 2,962 |
| Fixed income | 9,832 |
| Funds | 593 |
List of invested countries
(As of the end of December 2024)
| Equity & fixed-income investments |
Greece, South Africa, Netherlands, Norway, New Zealand, Denmark, Germany, Malaysia, Mexico, United States, Bermuda, Belgium, Brazil, Saudi Arabia, Sweden, Switzerland, Spain, Singapore, United Arab Emirates, Ireland, United Kingdom, Austria, Israel, Italy, India, Indonesia, Japan, China, Taiwan, Czech Republic, Chile, Kazakhstan, Qatar, Canada, Cayman Islands, Colombia, Kuwait, Thailand, Turkey, Peru, Portugal, Poland, France, Finland, Philippines, Hungary, Australia, Hong Kong |
|---|---|
| Equity investments | Jersey |
| Fixed-income investments | Latvia, Romania, Luxembourg, Lithuania, Macao, Bahrain, Bulgaria, Slovenia, Slovakia, Cyprus, Iceland, Andorra, Estonia, Uruguay, Egypt, Croatia, Panama |